
Today, we explore the Top 10 Forex Chart Patterns for 2024-25 that trigger trend reversals or continuations. Forex trading relies heavily on the analysis of price charts to predict future movements. Among the most effective tools for traders are chart patterns, which provide visual representations of price movements and potential market trends. Recognizing these patterns can significantly enhance a trader’s ability to make informed decisions.
In this article, we delve into the top 10 Forex chart patterns that every trader should know. From classic formations like Head and Shoulders to complex structures like the Harmonic Patterns, understanding these patterns can offer valuable insights and a strategic edge in the fast-paced world of Forex trading.
Main 3 Forex Chart Patterns
Chart patterns can be broadly categorized into three main groups, reflecting the movement of the asset’s price. (Listed below)
- Continuation Chart Patterns
- Continuation chart patterns are essential tools in technical analysis, indicating that the prevailing trend is likely to resume after a temporary consolidation or correction. These patterns help traders identify potential entry points that align with the ongoing market direction, enhancing their ability to capitalize on sustained price movements. Common continuation patterns include flags, pennants, and wedges, each characterized by distinct shapes and behaviors that signal a brief pause before the trend continues
- Reversal Chart Patterns
- Reversal chart patterns are crucial in technical analysis, signaling a potential change in the direction of an existing trend. These patterns suggest that the current trend, whether bullish or bearish, is losing strength, indicating a likely reversal. Key reversal patterns include Head and Shoulders, Double Tops and Bottoms, and Triple Tops and Bottoms. Each pattern reveals distinct characteristics that point to an impending reversal, giving traders valuable insights to adjust their positions.
- Bilateral Chart Patterns
- Bilateral chart patterns are distinct and adaptable formations in technical analysis, indicating potential price movement in either direction. They are essential for traders who must be prepared for various scenarios. Unlike continuation or reversal patterns, bilateral patterns — such as symmetrical triangles and rectangles — do not inherently suggest a specific trend direction but rather signal a significant breakout, either upward or downward. These patterns denote periods of consolidation where the market is indecisive, and a breakout in any direction can lead to substantial price movement. By identifying and understanding bilateral chart patterns, traders can strategize effectively, positioning themselves and setting stop-loss orders to capitalize on the eventual breakout, regardless of its direction.
Forex Chart patterns are essential tools in technical analysis, providing insights into market sentiment and potential price movements. Mastering these patterns enables traders to make informed decisions, enhancing their ability to predict market movements and optimize trading strategies.
Top 10 Forex Chart Patterns in 2024-25

Here are the Top 10 Forex Chart Patterns for 2024-2025.
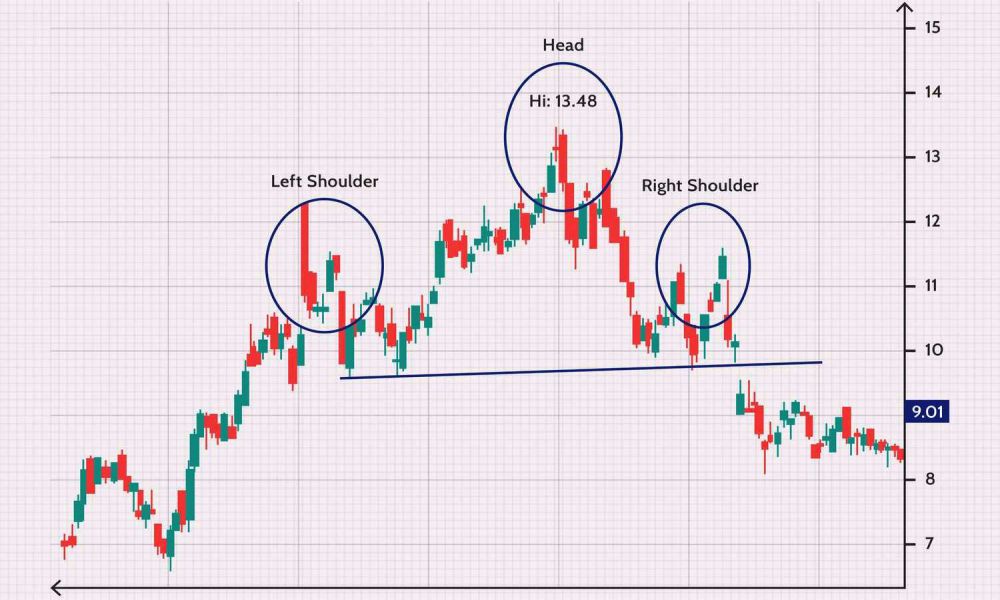
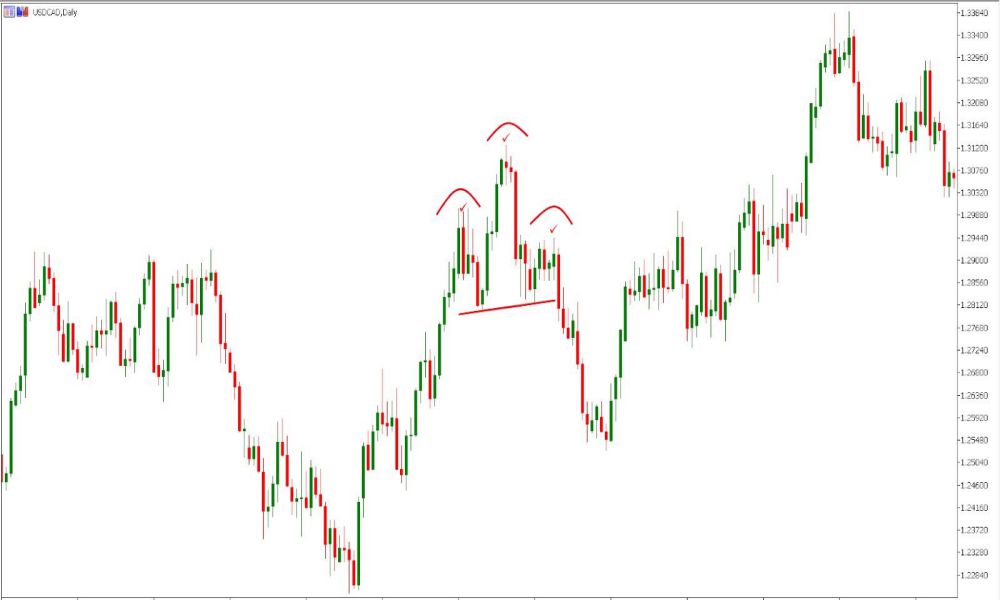
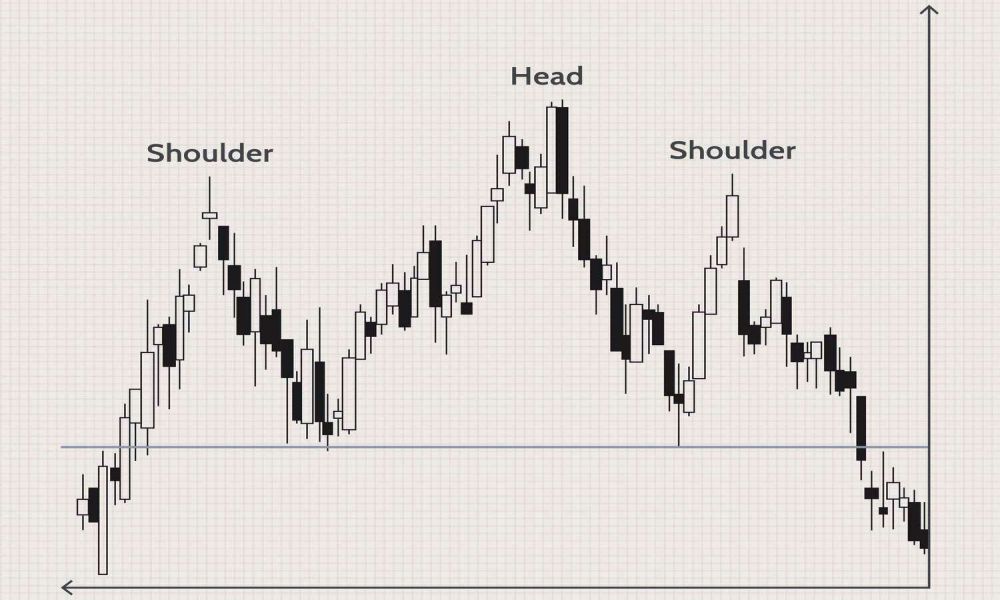
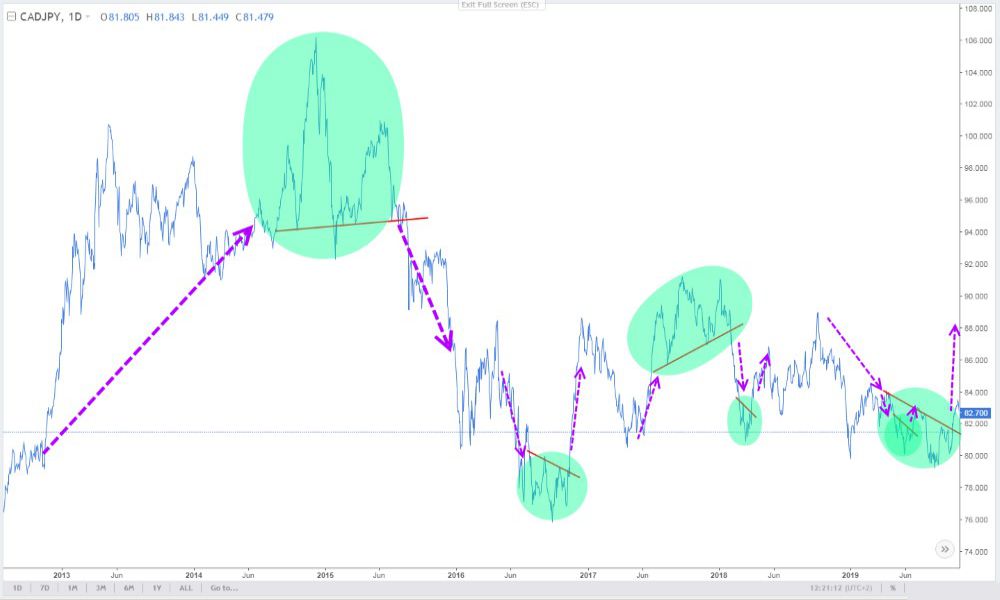
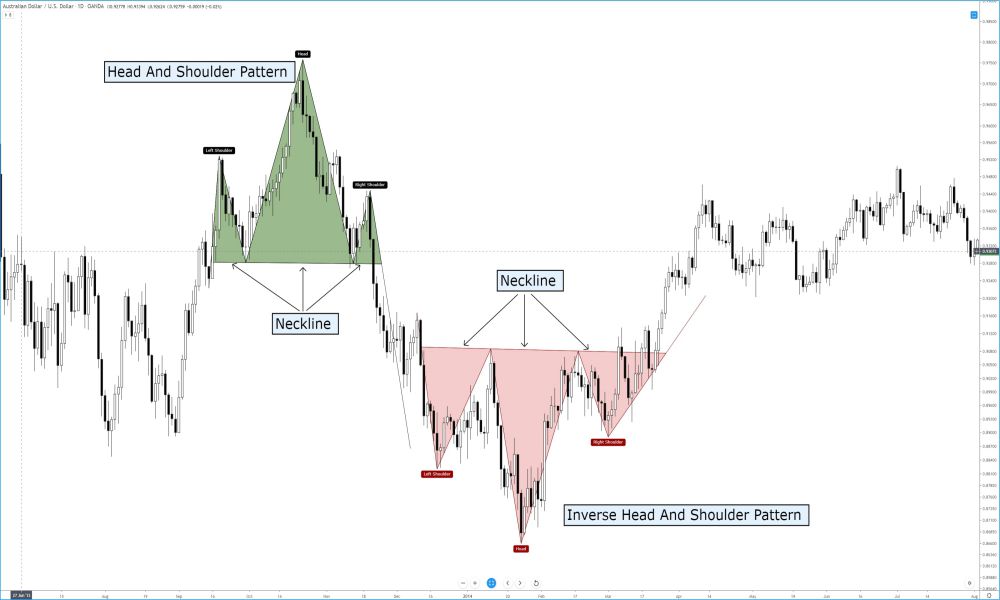
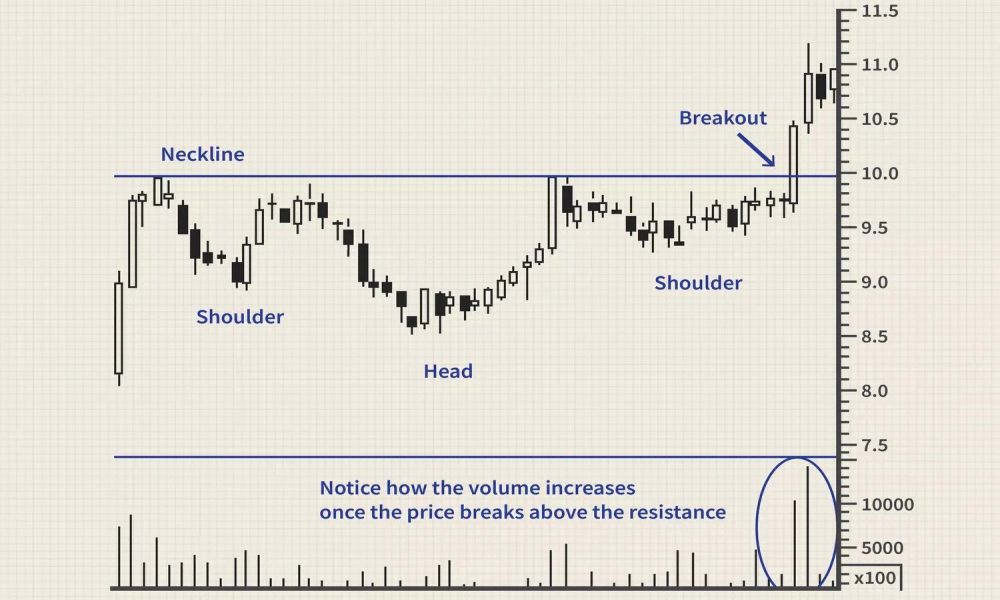
The Head and Shoulders forex chart pattern is one of the most reliable and well-known reversal patterns in technical analysis, signaling a potential trend change. This pattern typically forms after an extended trend and is comprised of three peaks: the left shoulder, the head, and the right shoulder. The left shoulder marks a peak followed by a temporary decline. The head is a higher peak that forms in the middle, followed by another decline. The right shoulder is a lower peak, mirroring the left shoulder, and is followed by another decline. The neckline, drawn by connecting the lows of the left shoulder and the head, serves as a key support level.
When the price breaks below the neckline after forming the right shoulder, it confirms the pattern, indicating a bearish reversal if the pattern appears at the top of an uptrend. Conversely, an inverse Head and Shoulders pattern, with the peaks inverted, signals a bullish reversal at the bottom of a downtrend. Traders often use the distance between the head and the neckline to project the potential price movement following the breakout. By recognizing the Head and Shoulders pattern, traders can anticipate significant trend reversals and adjust their trading strategies accordingly, optimizing their potential for profit while managing risk.
Refer to the images below for The Head and Shoulders Chart Pattern’s pictorial guidance;
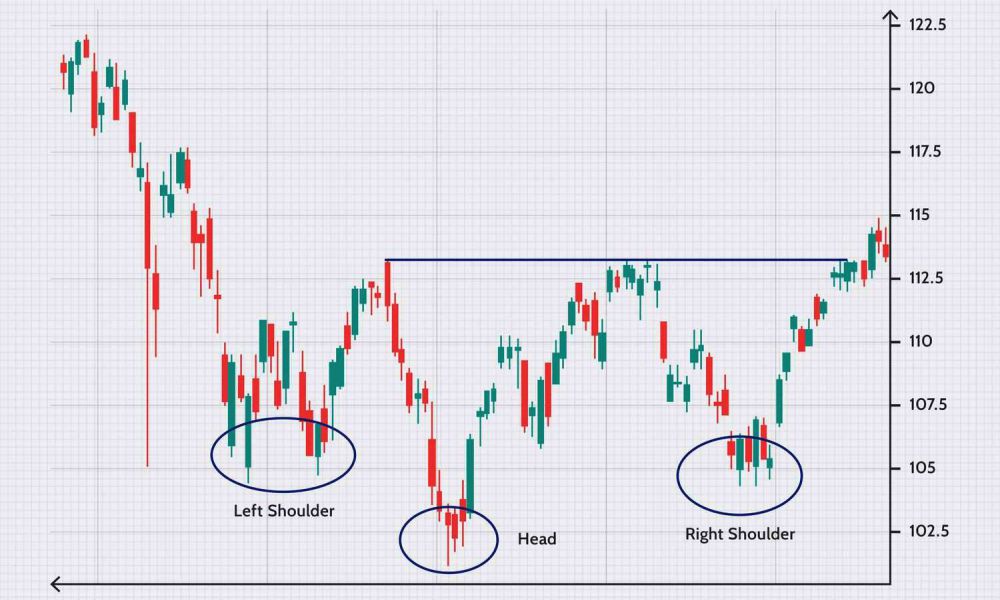
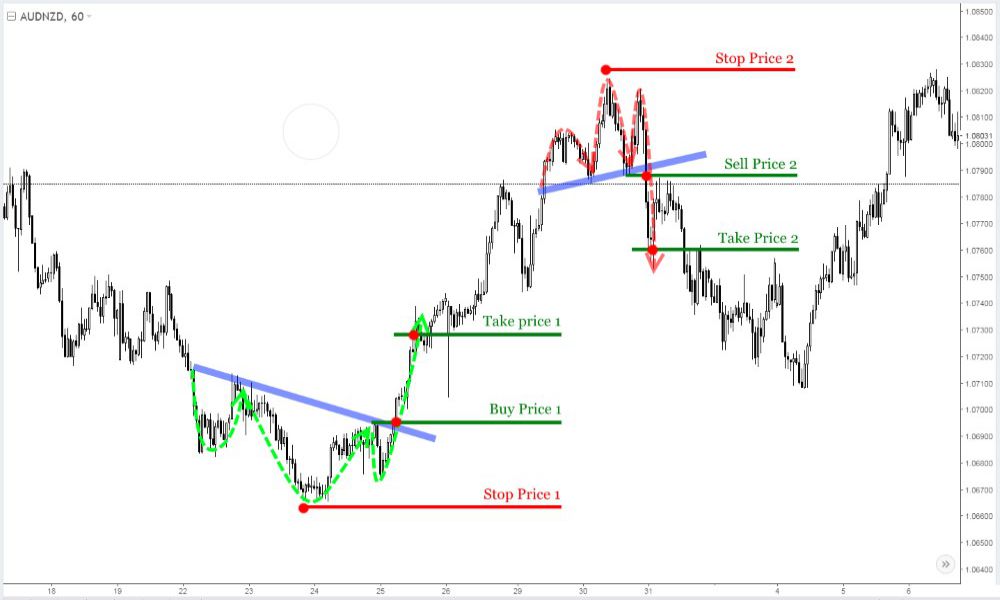
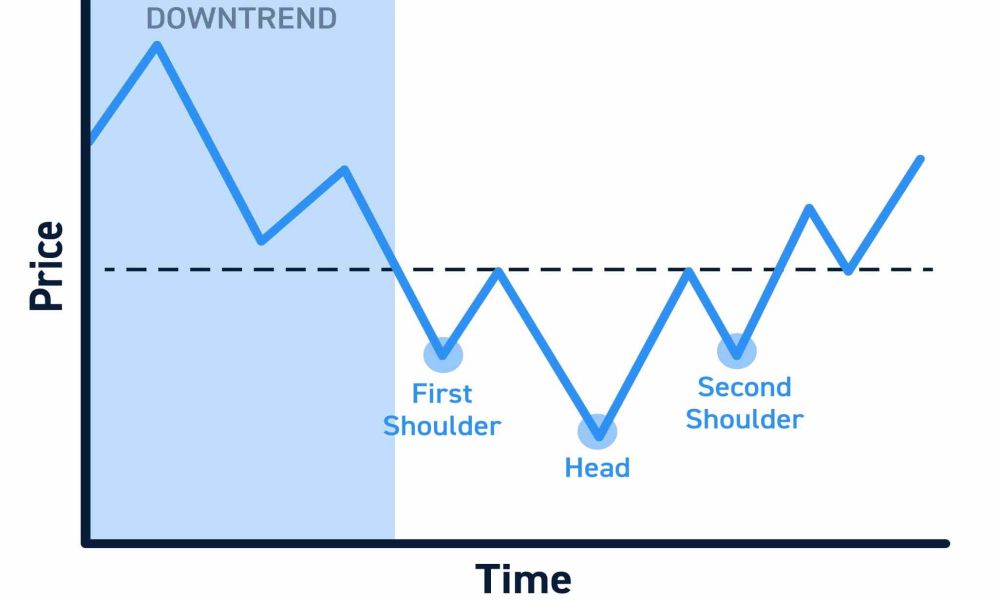
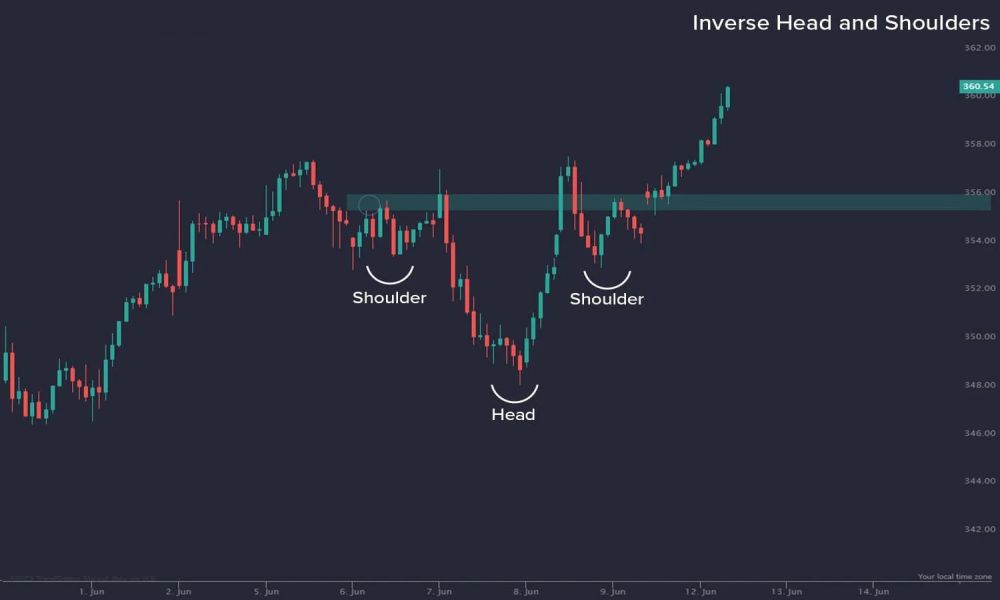
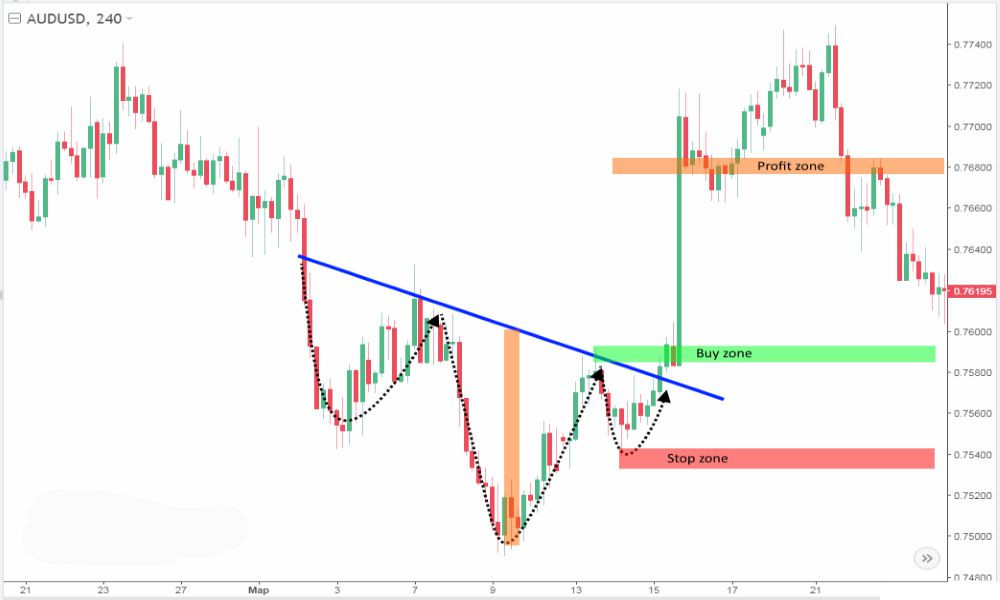
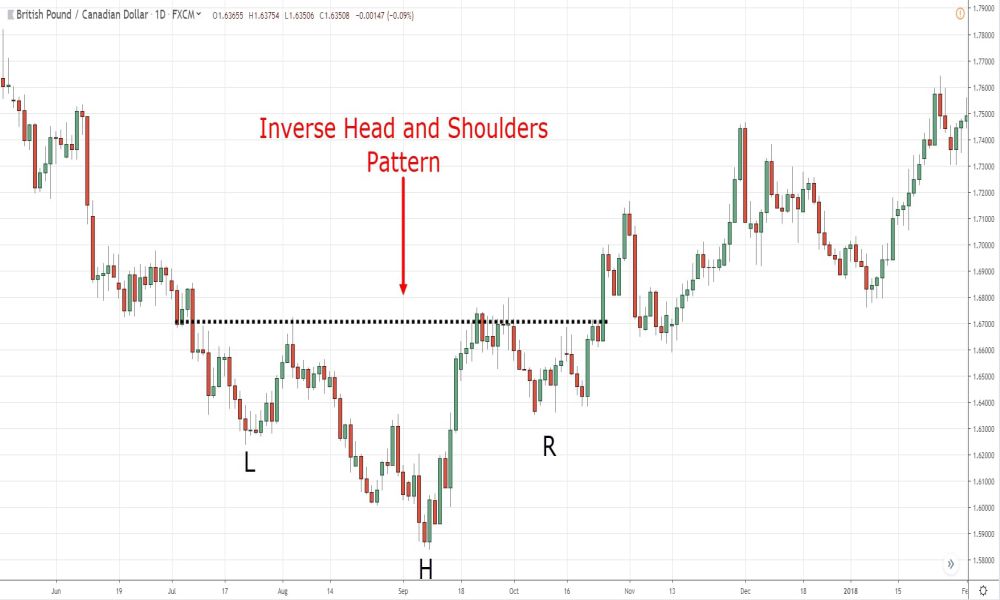
The inverse head and shoulders chart pattern is a technical analysis indicator used to identify potential reversals in a downtrend. It consists of three successive troughs, where the middle trough (the head) is the lowest, and the two outside troughs (the shoulders) are higher and roughly equal in height. The pattern is completed when a neckline, formed by connecting the peaks of the two intervening rallies, is broken to the upside. This break signals a shift in market sentiment from bearish to bullish, suggesting the downtrend may be reversing and an uptrend is likely to commence.
Traders often look for confirmation of the pattern through increased trading volume on the breakout above the neckline. This surge in volume indicates strong buying interest, reinforcing the likelihood of a trend reversal. Additionally, measuring the distance from the head to the neckline and projecting it upwards from the breakout point can provide a target price for the ensuing uptrend. The inverse head and shoulders pattern is widely regarded as a reliable signal of a bullish reversal, making it a valuable tool for traders seeking to capitalize on market turnarounds.
Refer to the images below for The Inverse Head and Shoulders Chart Pattern’s pictorial guidance;
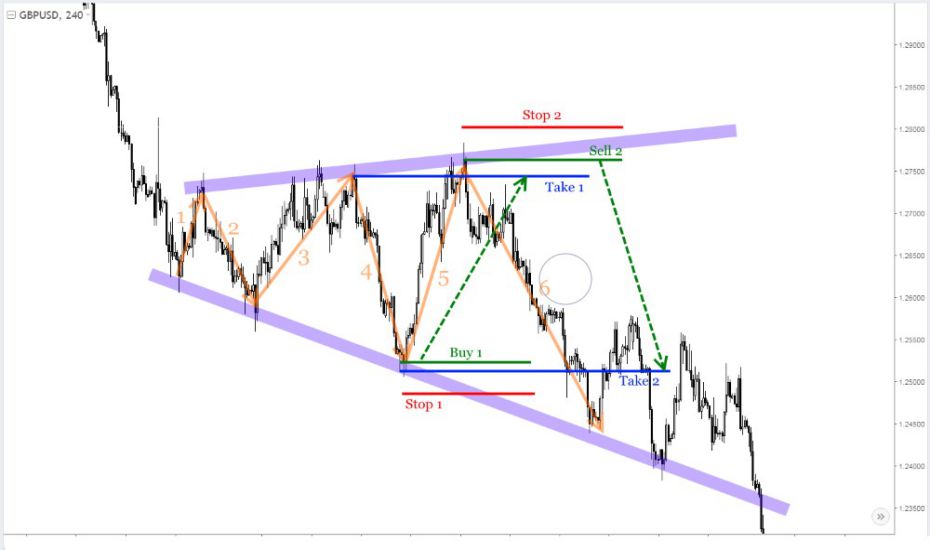
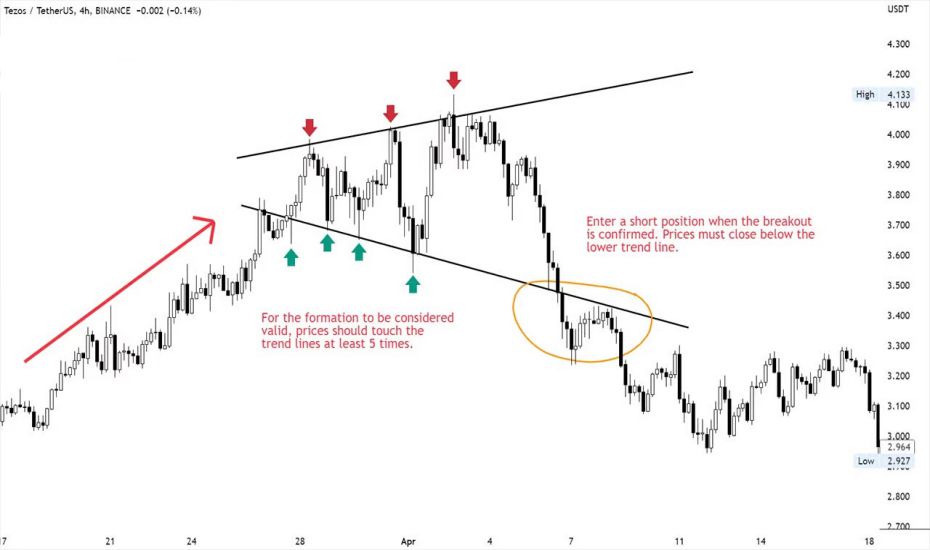
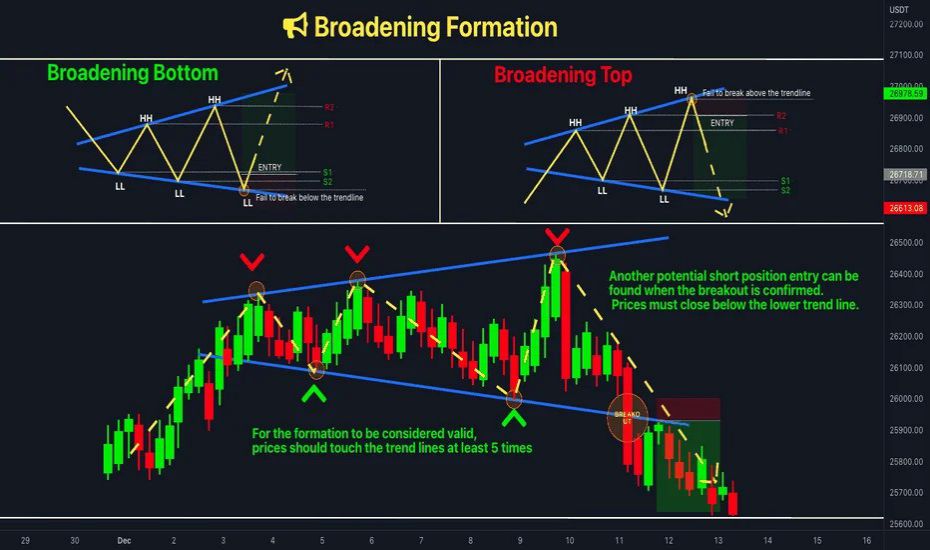
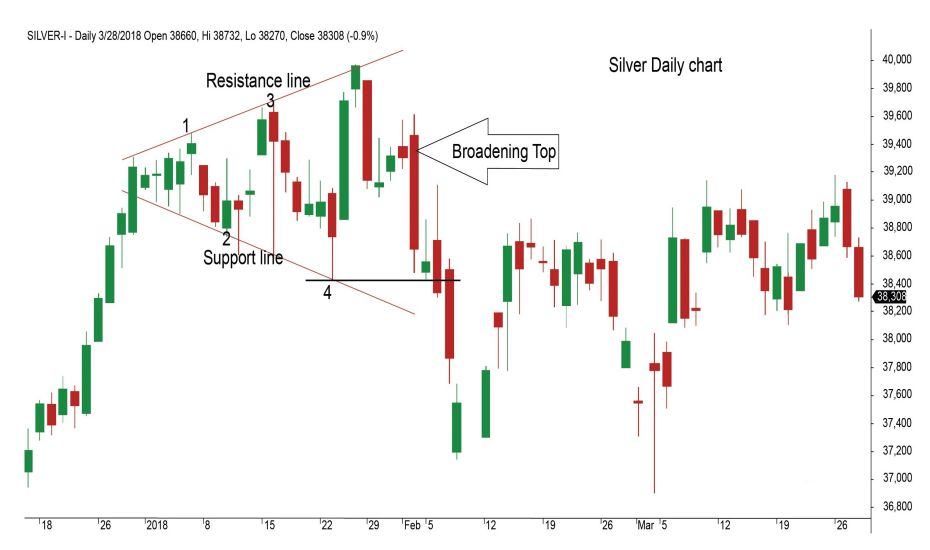
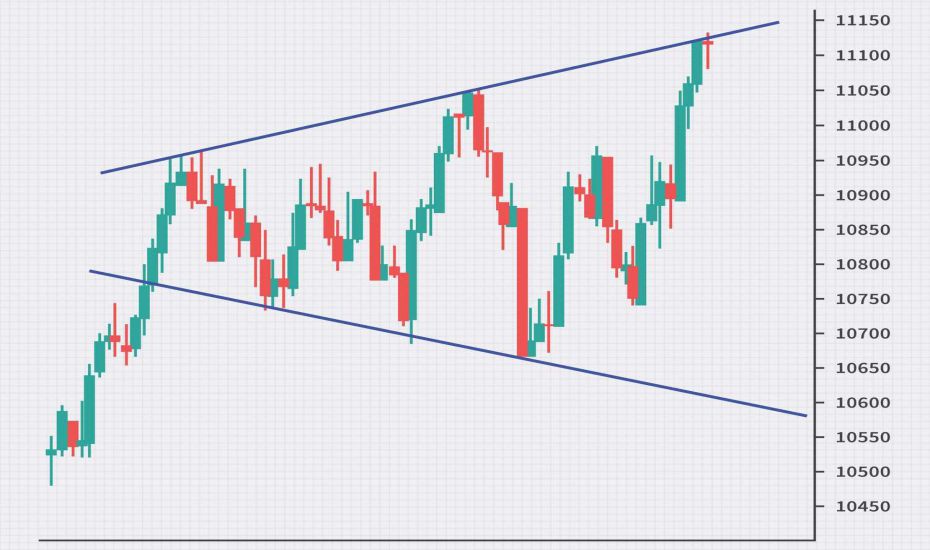
The Broadening Formation, also known as a Megaphone Pattern, is a distinctive chart pattern in technical analysis that indicates increasing volatility and potential trend continuation or reversal. This pattern is characterized by two diverging trendlines, one sloping upward and the other downward, creating a shape that resembles a megaphone. The pattern typically features at least three peaks and two troughs, with each successive peak higher than the previous one and each trough lower, illustrating widening price swings.
The Broadening Formation can occur in both bullish and bearish markets. In a bullish scenario, it may signal an impending reversal if it forms at the top of an uptrend, suggesting that buyers are losing control as volatility increases. Conversely, in a bearish market, the pattern might indicate continued downward momentum or a potential reversal if it appears at the bottom of a downtrend.
Trading the Broadening Formation requires careful analysis and strategy. Traders often look for confirmation of a breakout above the upper trendline or below the lower trendline before making trading decisions. This breakout direction provides clues about the likely future price movement. Stop-loss orders are typically placed just outside the formation to manage risk effectively, considering the pattern’s inherent volatility.
Understanding and identifying the Broadening Formation allows traders to anticipate significant price movements and adjust their strategies accordingly, capitalizing on the pattern’s predictive power while mitigating potential risks.
Refer to the images below for The Broadening Formation or Megaphone Pattern’s pictorial guidance;

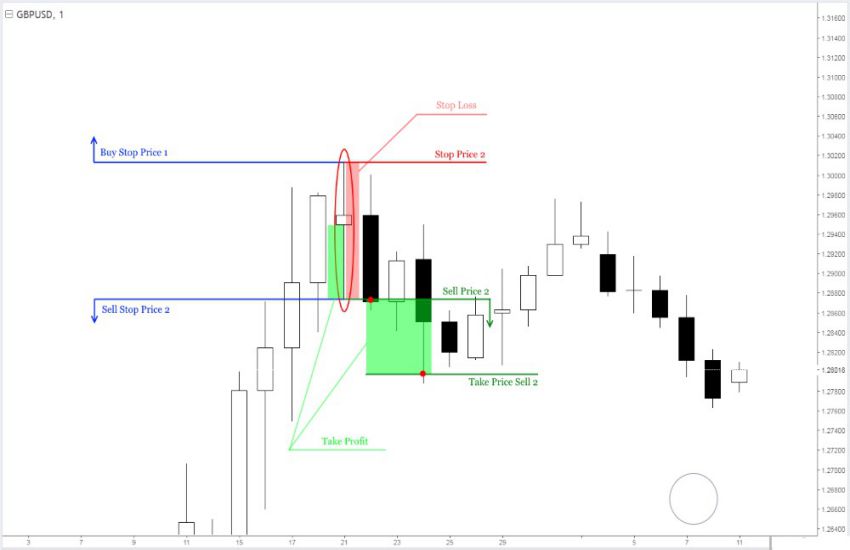
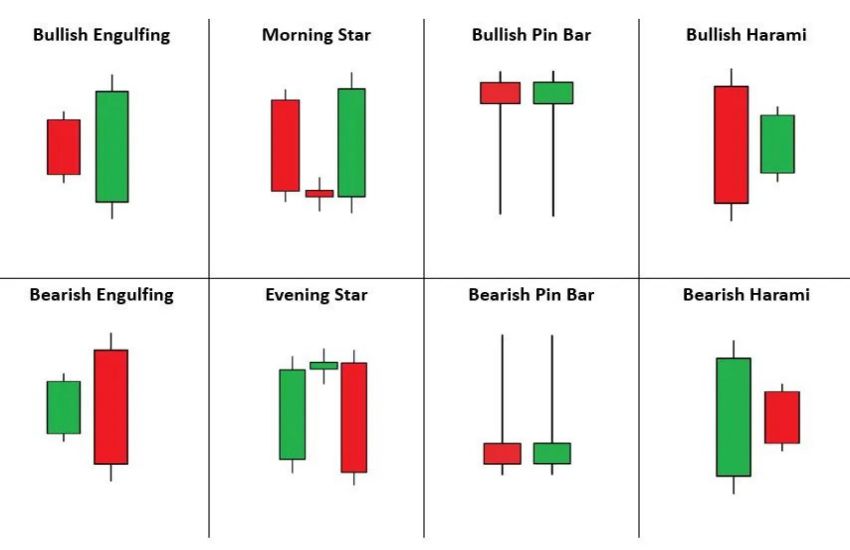
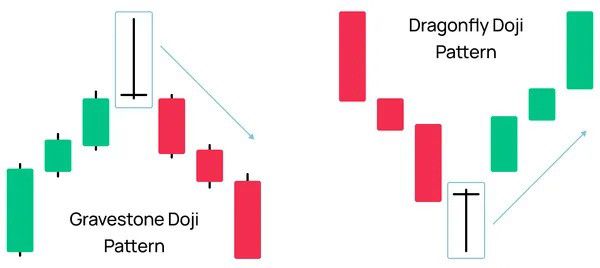
The Volume Candlestick pattern integrates volume analysis with candlestick patterns to provide a more comprehensive view of market dynamics and potential price movements. Volume, representing the number of shares or contracts traded within a given period, adds depth to candlestick signals by highlighting the strength or weakness behind price actions.
A key aspect of this pattern is the confirmation that volume provides to candlestick formations. For instance, a bullish candlestick pattern, such as a Hammer or a Bullish Engulfing pattern, is considered more reliable if accompanied by an increase in volume. This surge in volume confirms strong buying interest and enhances the credibility of the bullish signal. Conversely, if a bearish pattern like a Shooting Star or a Bearish Engulfing occurs with high volume, it indicates robust selling pressure, reinforcing the potential for a downtrend.
Volume analysis helps traders distinguish between genuine trend reversals and false signals. A candlestick pattern with low volume might suggest a lack of commitment from market participants, making the pattern less reliable. By integrating volume into candlestick analysis, traders gain a clearer picture of market sentiment, allowing for more informed decision-making and improved accuracy in predicting price movements.
Refer to the images below for The Volume Candlestick Pattern’s pictorial guidance;
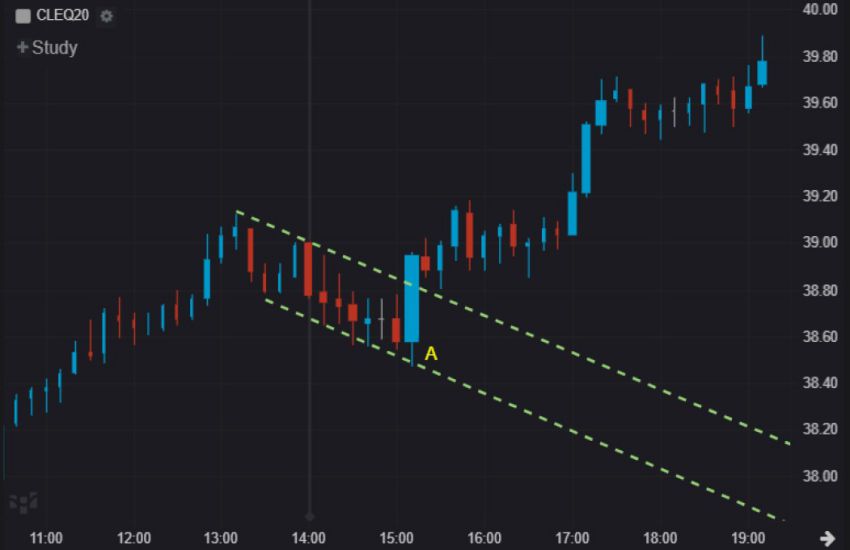
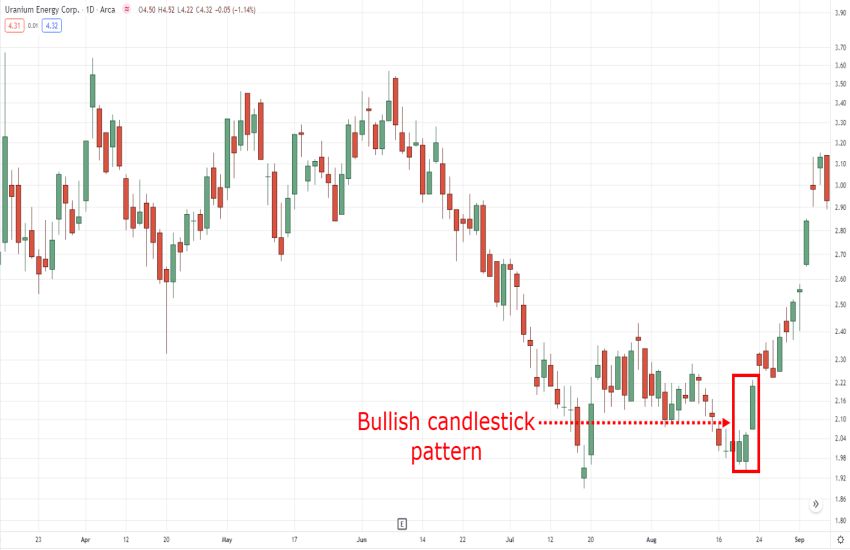
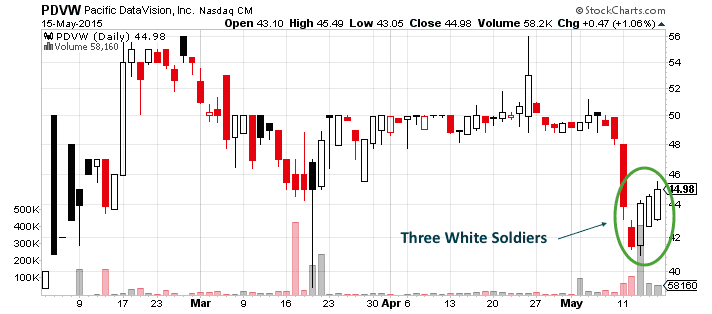
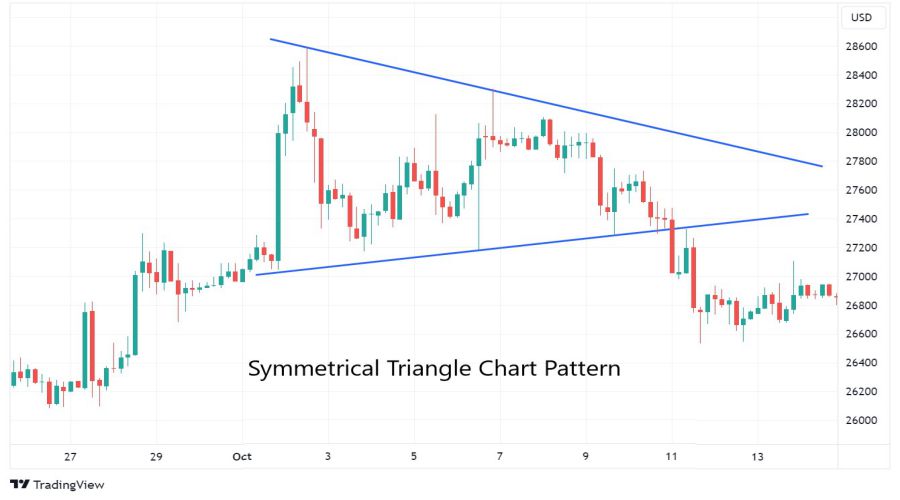
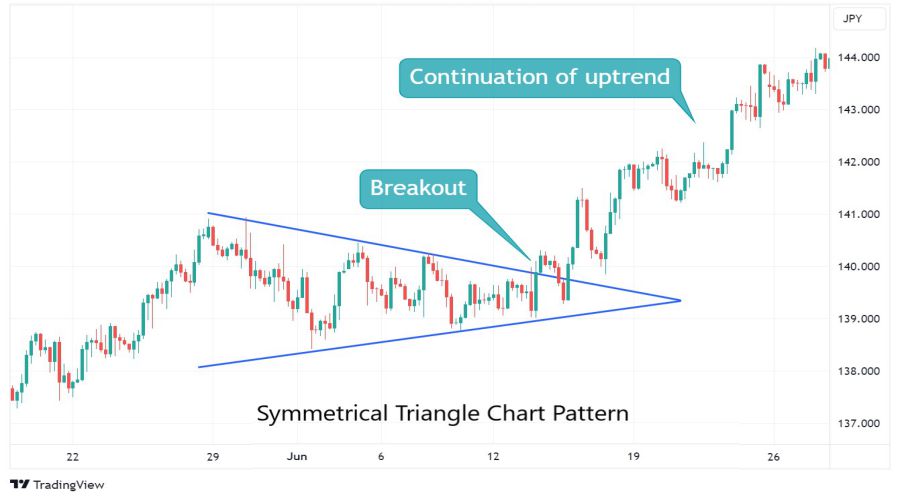
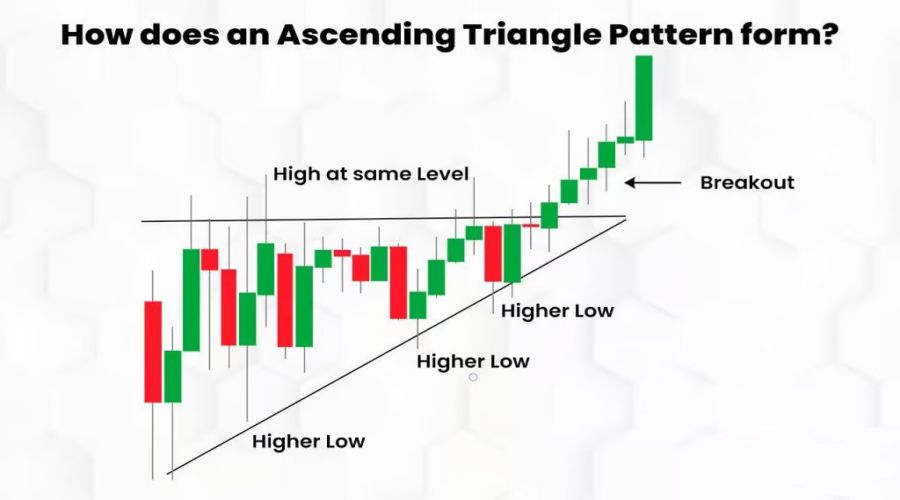
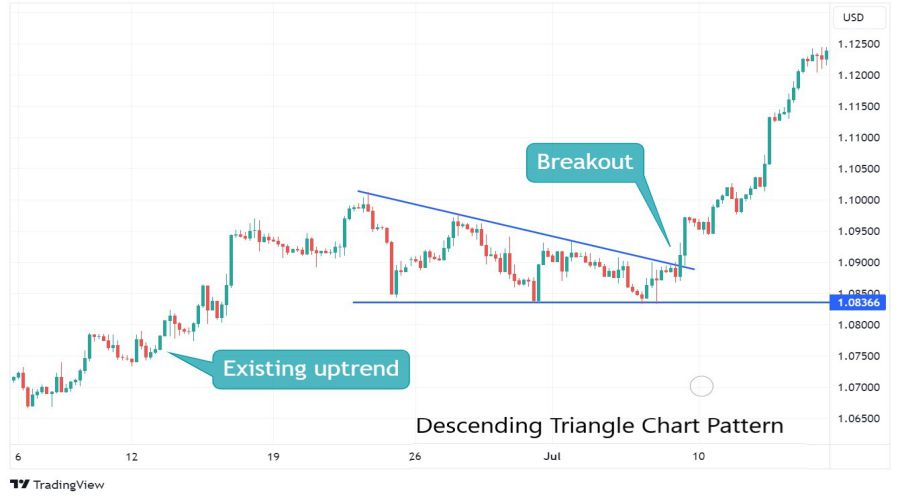
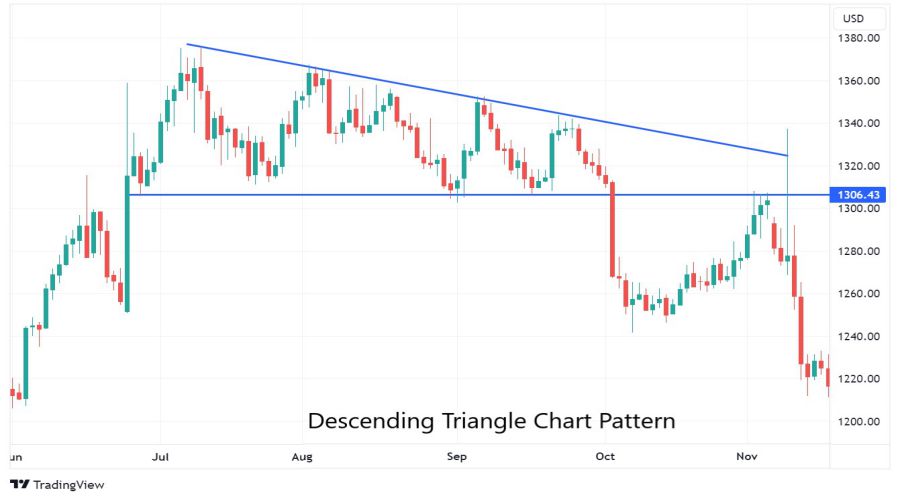
In Top 10 Forex Chart Patterns, The Triangle chart pattern is on number 5. It is a fundamental consolidation pattern in technical analysis, characterized by converging trendlines that form a triangular shape on the price chart. This pattern occurs when the market is in a period of consolidation, where the price movements become tighter as it prepares for a significant breakout. There are three main types of Triangle patterns: Symmetrical, Ascending, and Descending.
- Symmetrical Triangle: Formed by two converging trendlines—one connecting lower highs and the other connecting higher lows—this pattern indicates a period of indecision in the market. The symmetrical triangle typically suggests that a breakout is imminent, but the direction is uncertain until the price moves decisively through one of the trendlines. A breakout above the upper trendline can signal a continuation of the uptrend, while a breakout below the lower trendline can signal a continuation of the downtrend.
- Ascending Triangle: Characterized by a horizontal upper trendline and an upward-sloping lower trendline, the ascending triangle is typically seen as a bullish pattern. It indicates that buyers are becoming increasingly aggressive, pushing the price higher, while sellers struggle to maintain control. A breakout above the horizontal trendline often confirms a bullish continuation, signaling potential upward momentum.
- Descending Triangle: This pattern features a horizontal lower trendline and a downward-sloping upper trendline, signaling a bearish sentiment. It suggests that sellers are gaining strength, pushing the price lower, while buyers struggle to keep prices from falling further. A breakout below the horizontal trendline is often seen as a bearish signal, indicating potential downward momentum.
Traders often use the Triangle chart pattern to anticipate breakout points and set strategic entry and exit points. By analyzing the price action within the triangle and observing the breakout direction, traders can make informed decisions and capitalize on potential market moves.
Refer to the images below for The Triangle Chart Pattern’s pictorial guidance;

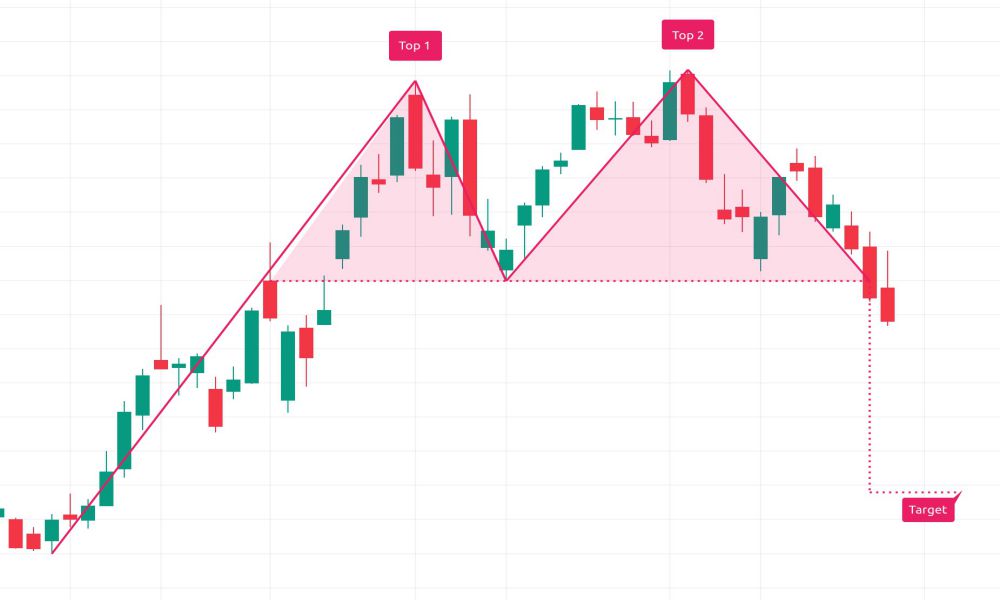
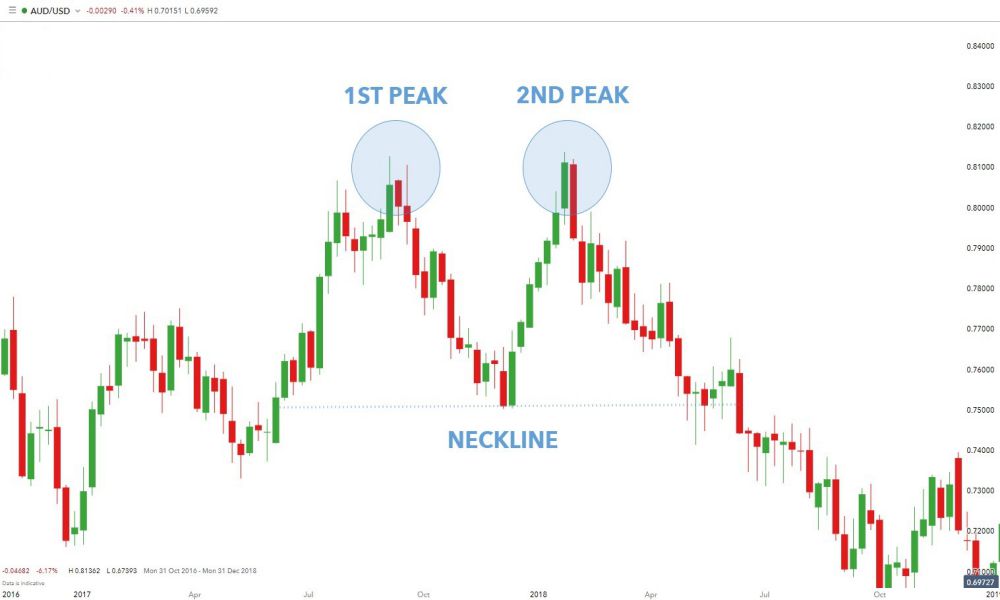
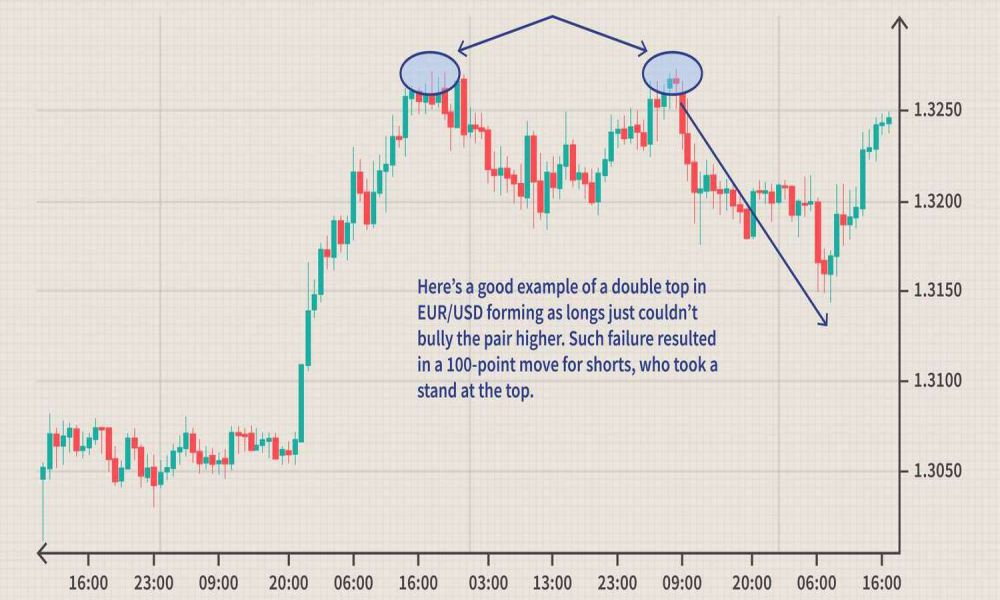
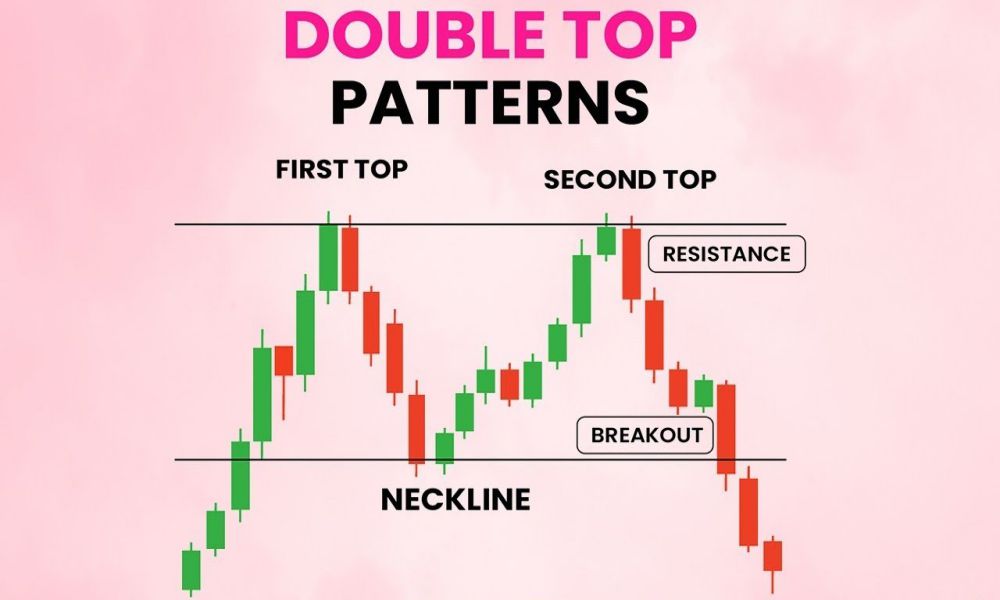
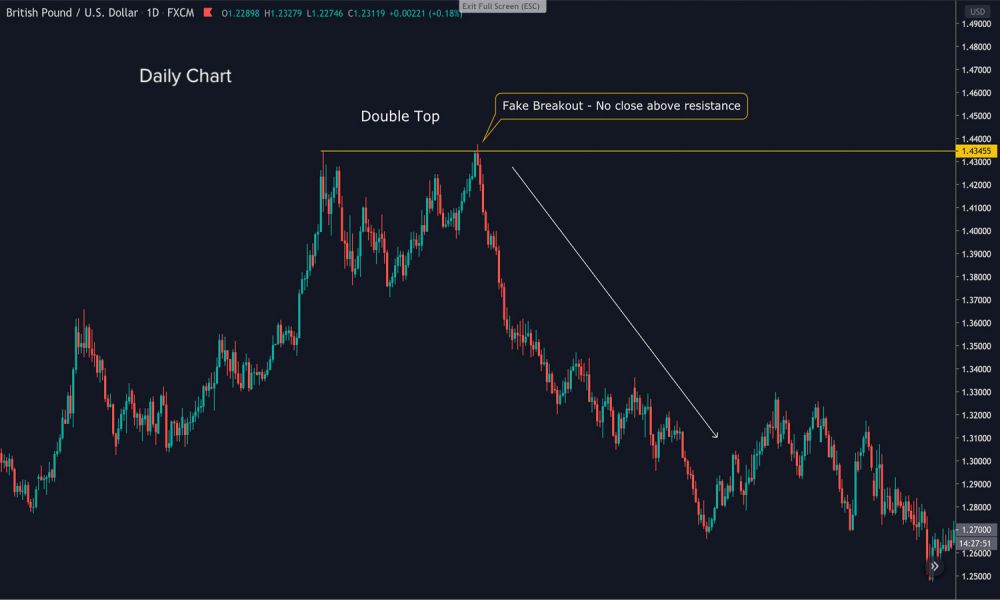
The Double Top chart pattern is a classic bearish reversal formation that signals a potential end to an uptrend and the beginning of a downtrend. This pattern consists of two distinct peaks, or “tops,” at approximately the same price level, separated by a trough. The first top is formed after a strong uptrend, followed by a decline that creates the trough, and then a second peak at a similar level as the first top. The pattern is completed when the price breaks below the trough, known as the “neckline,” which confirms the reversal signal.
Traders view the Double Top pattern as a sign that the buying pressure is weakening, and sellers are starting to take control. The pattern indicates that the previous highs are no longer sustainable, and a potential downtrend is imminent. To gauge the potential price movement, traders often measure the vertical distance between the tops and the neckline, projecting this distance downward from the neckline to estimate the target price after the breakdown. Recognizing and acting on the Double Top pattern allows traders to anticipate market reversals and make informed decisions to capitalize on the expected downtrend while managing their risk effectively.
Refer to the images below for The Double Top Chart Pattern’s pictorial guidance;
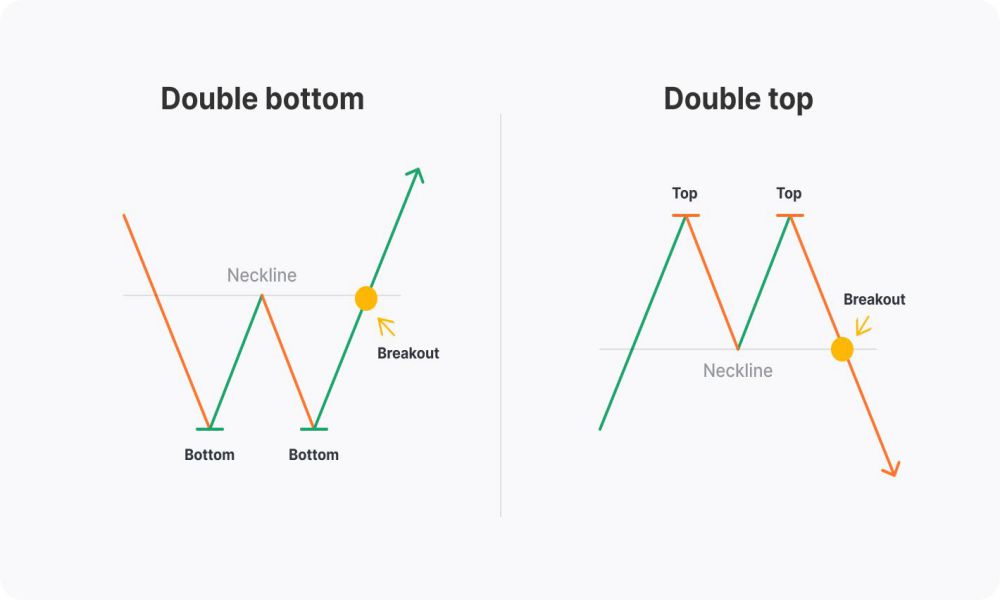
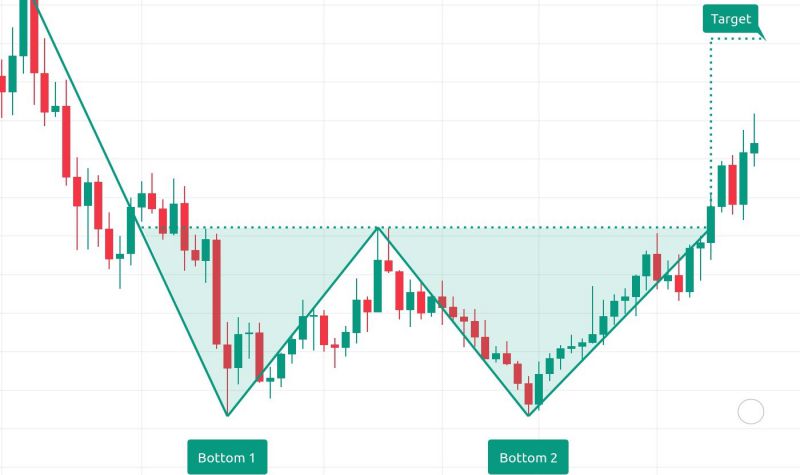
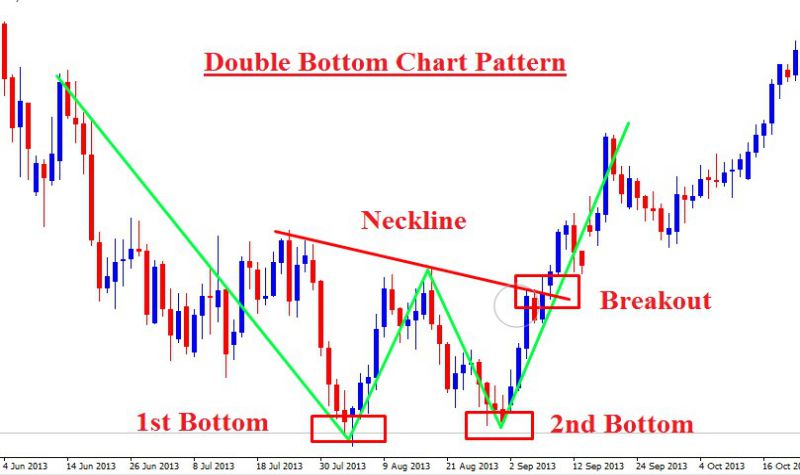
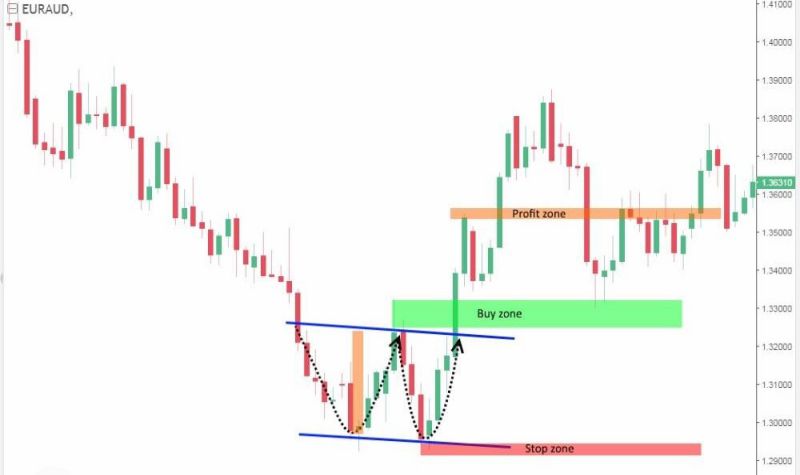
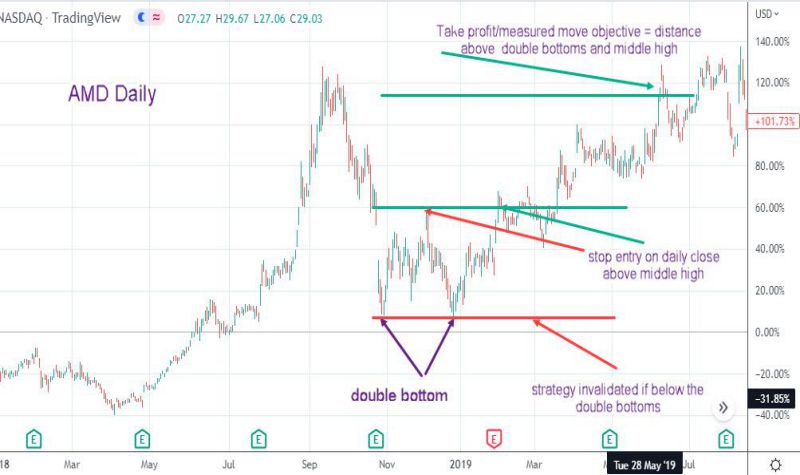
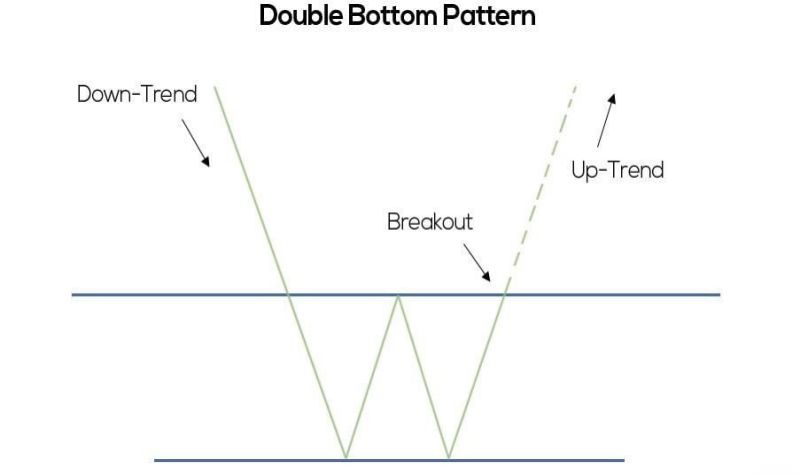
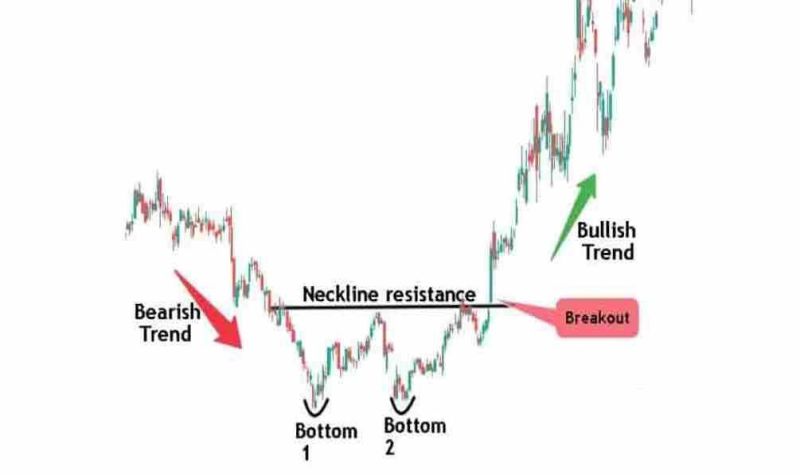
The Double Bottom chart pattern is a bullish reversal pattern that indicates a potential shift from a downtrend to an uptrend. This pattern forms after a prolonged decline and is characterized by two distinct troughs or “bottoms” at approximately the same price level, separated by a peak or “neckline.” The formation begins with a significant drop in price, creating the first bottom as selling pressure eases. The price then rallies to a resistance level, forming the peak, before declining again to create the second bottom, which typically aligns closely with the first bottom. This second trough reflects a test of the previous low, and the failure to break lower suggests that the selling pressure is diminishing and buyers are gaining strength.
The pattern is confirmed when the price breaks above the resistance level or neckline formed by the peak between the two bottoms. This breakout signifies a potential reversal, signaling traders to consider entering long positions. Volume analysis can further validate the pattern, with higher trading volumes during the second bottom and the breakout indicating stronger buying interest. Traders often measure the distance from the neckline to the bottom of the pattern to estimate the potential price target following the breakout. Recognizing and understanding the Double Bottom chart pattern allows traders to capitalize on emerging uptrends, enhancing their ability to make profitable trading decisions.
Refer to the images below for The Double Bottom Chart Pattern’s pictorial guidance;
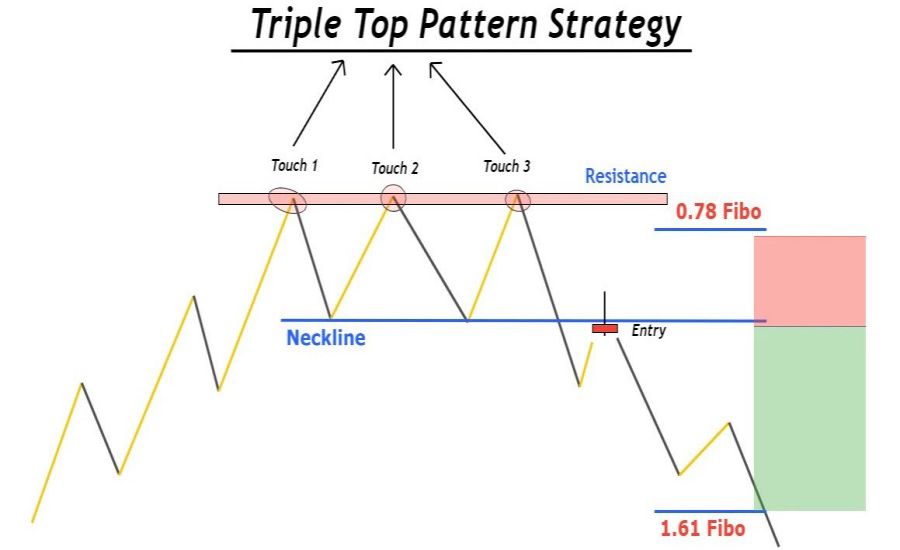
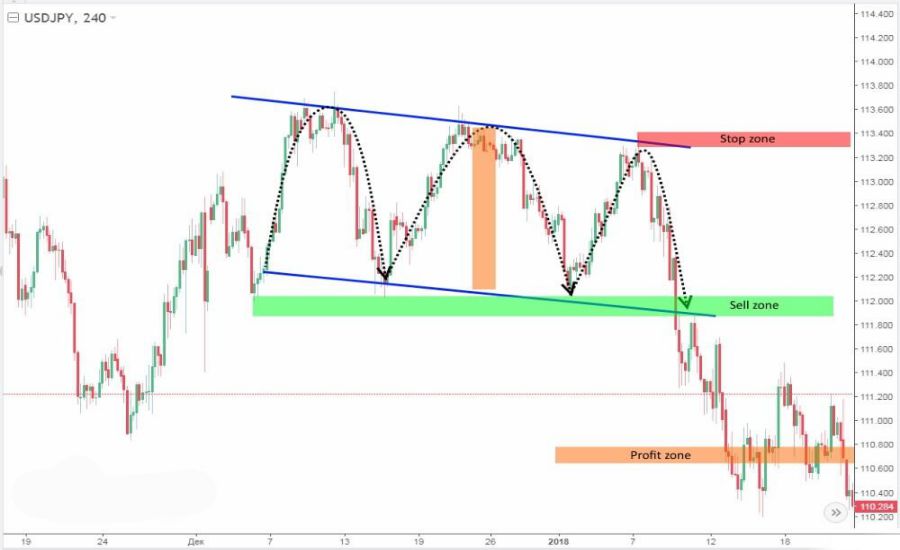
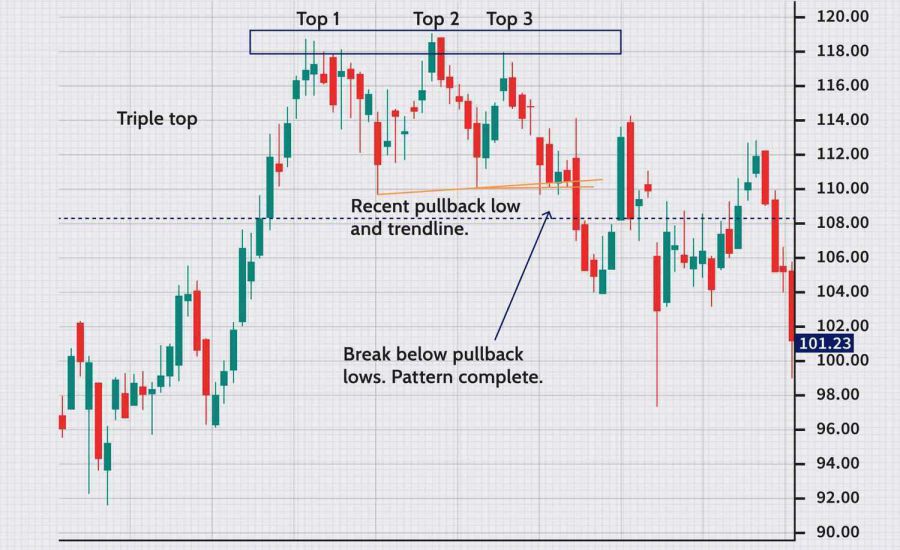
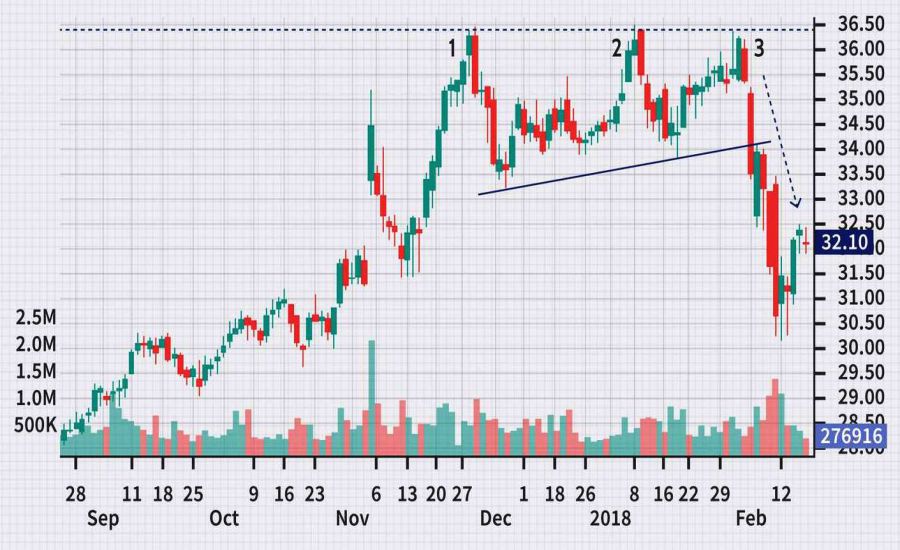
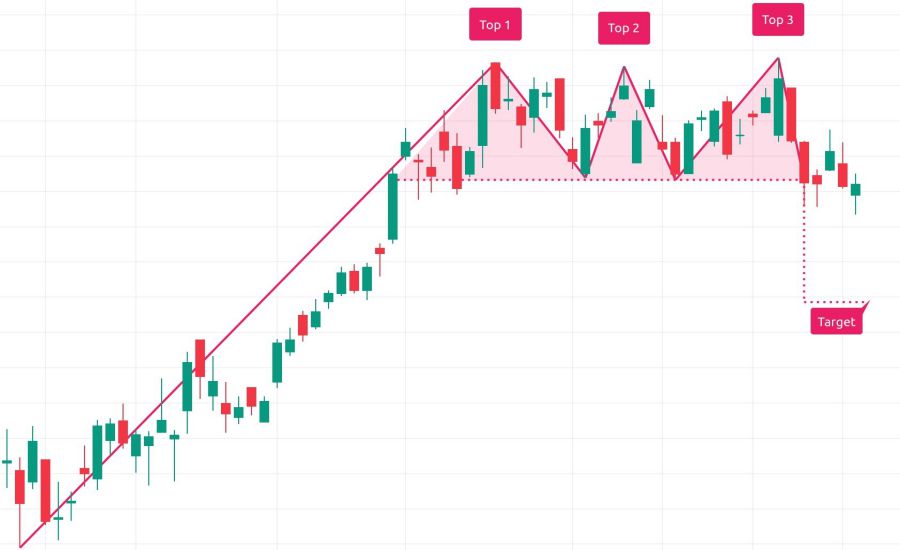
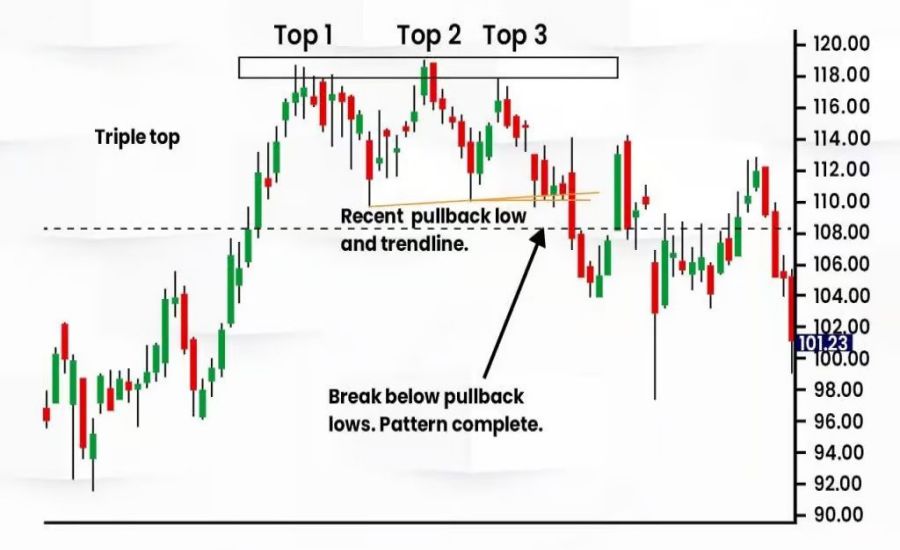
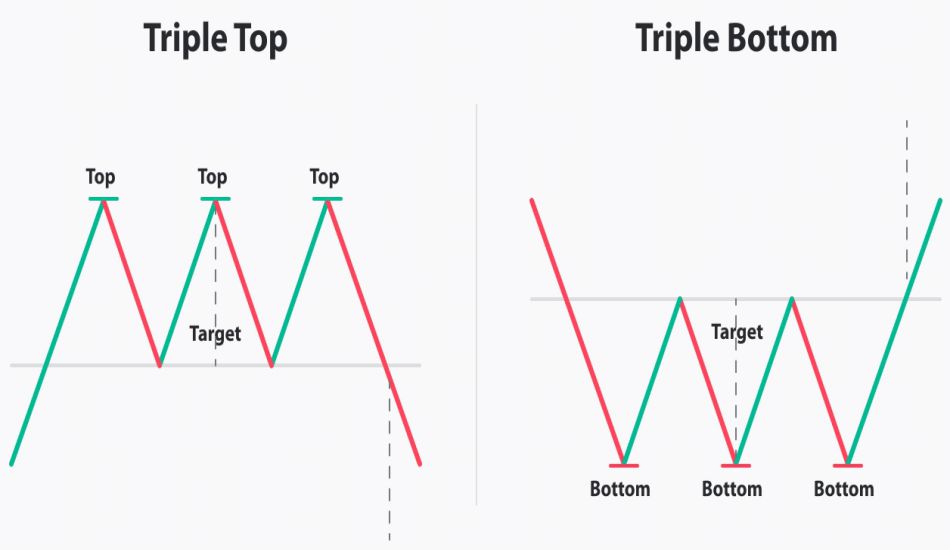
The Triple Top pattern is a bearish reversal pattern seen in technical analysis, commonly used by traders to predict potential price reversals in the forex market. It is characterized by three distinct peaks, each reaching approximately the same price level, with two intervening troughs.
Key Characteristics:
- Three Peaks: The pattern consists of three highs (peaks), each reaching a similar price level, indicating strong resistance.
- Troughs: Two intervening lows (troughs) between the peaks.
- Volume: Volume typically decreases with each successive peak, indicating waning buying pressure.
- Duration: The formation can take several weeks to several months, depending on the timeframe.
- Confirmation: The pattern is confirmed when the price breaks below the support level formed by the two intervening troughs.
Formation Stages:
- First Peak: The price rises to a resistance level and then falls.
- Second Peak: The price rises again, tests the same resistance level, and falls again.
- Third Peak: The price makes a final attempt to break the resistance but fails and falls again.
Trading the Triple Top Pattern:
- Identification: Identify the pattern with three distinct peaks at similar price levels.
- Wait for Confirmation: Confirmation occurs when the price breaks below the support level formed by the two troughs.
- Enter Position: Enter a short position once the support level is breached.
- Stop Loss: Place a stop-loss order above the resistance level (above the highest peak).
- Target Price: The target price can be estimated by measuring the distance between the peaks and the support level, then subtracting this distance from the breakout point.
Limitations:
- False Breakouts: There is a risk of false breakouts, where the price temporarily breaks the support level but quickly reverses.
- Time-Consuming: The pattern can take a long time to form, requiring patience and discipline from traders.
- Market Conditions: The pattern’s reliability can be affected by broader market conditions and news events.
The Triple Top pattern is a valuable tool for forex traders, helping to identify potential bearish reversals. By recognizing this pattern and waiting for confirmation, traders can make more informed trading decisions. However, it is crucial to use this pattern in conjunction with other technical indicators and analysis methods to improve the accuracy of predictions and manage risk effectively.
Refer to the images below for The Triple Top Forex Chart Pattern’s pictorial guidance;
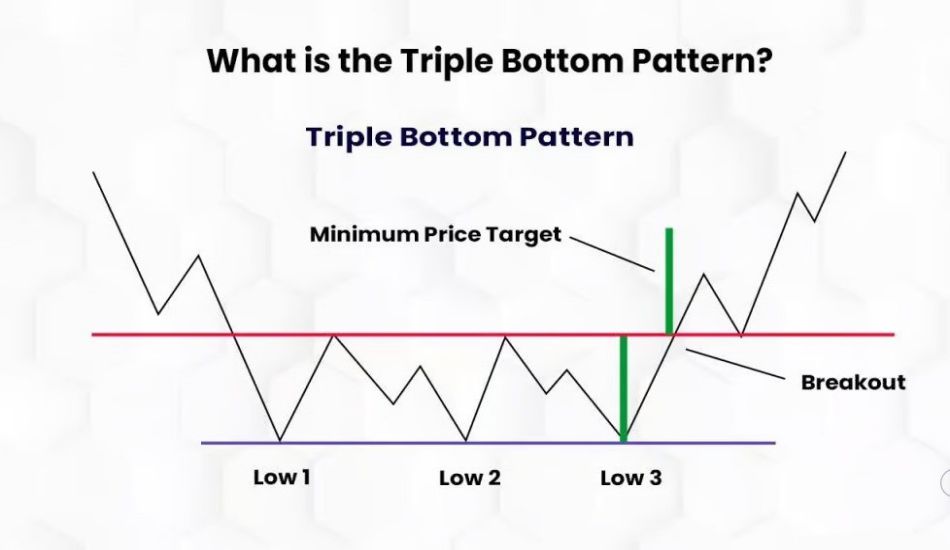
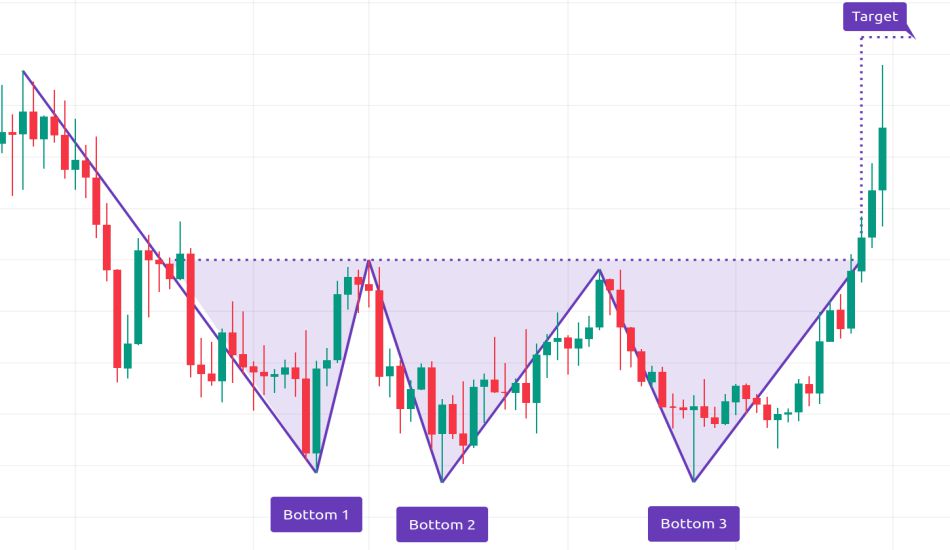
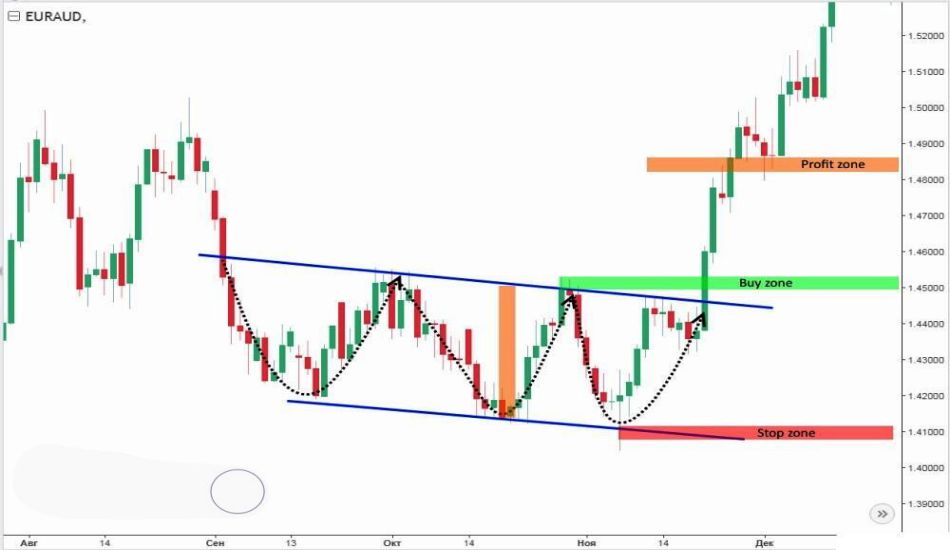
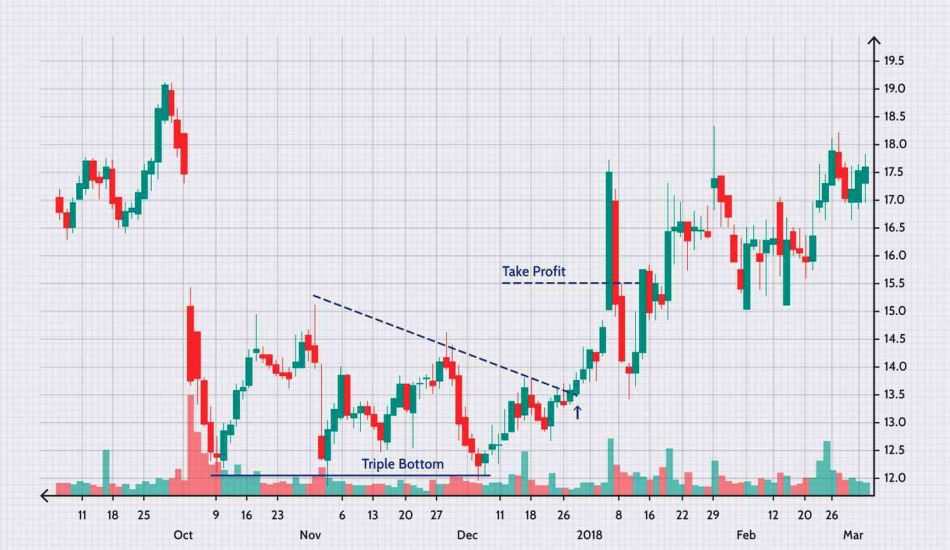
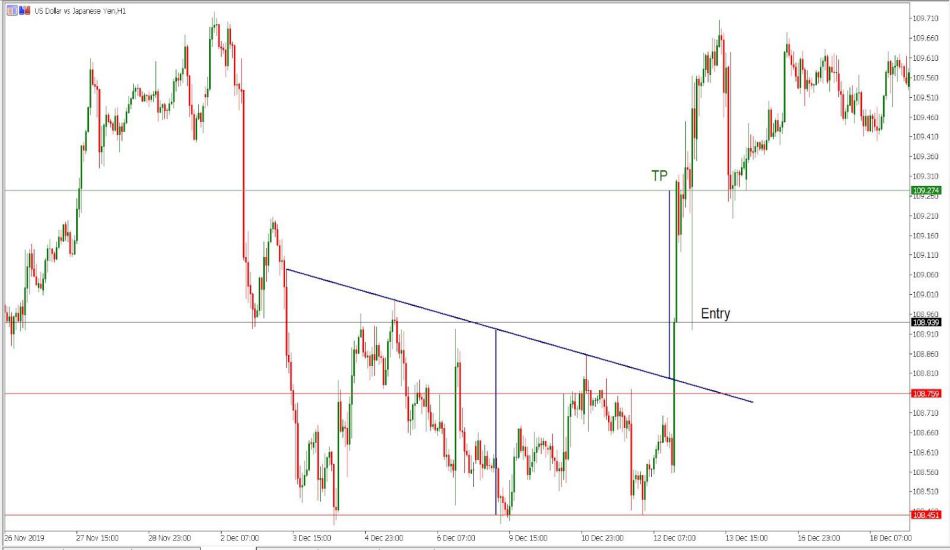
Second last in the list, The Triple Bottom Forex Chart Pattern is a bullish reversal pattern that signals the end of a downtrend and the potential beginning of an uptrend. It is formed after three consecutive declines to a similar level, followed by a breakout above the resistance level. Here’s a detailed look at this pattern:
Characteristics of the Triple Bottom Pattern:
- Three Lows at the Same Level: The pattern consists of three distinct lows at approximately the same price level. These lows indicate strong support as the price fails to move below this level three times.
- Equal Highs Between Lows: The peaks between the lows are relatively equal, showing resistance levels where selling pressure is high.
- Volume Confirmation: Volume typically decreases as the pattern forms and increases on the breakout above the resistance level. High volume on the breakout confirms the pattern.
- Resistance Level: The line drawn at the peaks between the three lows acts as the resistance level. A breakout above this line signals a bullish reversal.
Formation Stages:
- First Bottom: The first decline in price to a support level, followed by a bounce.
- Second Bottom: The second decline to the same support level as the first bottom, followed by another bounce. This reaffirms the support level.
- Third Bottom: The third decline to the same support level, followed by a stronger bounce as buyers step in, anticipating a reversal.
- Breakout: The price breaks above the resistance level (the highs between the lows) with increased volume, confirming the bullish reversal.
Trading the Triple Bottom Pattern:
- Entry Point: Traders typically enter a long position when the price breaks above the resistance level with significant volume. This breakout indicates that the downtrend has ended, and a new uptrend may begin.
- Stop-Loss: A stop-loss order is often placed below the third bottom to protect against false breakouts and minimize potential losses if the pattern fails.
- Profit Target: The profit target can be estimated by measuring the distance from the support level (bottoms) to the resistance level (highs between the bottoms) and projecting this distance upward from the breakout point.
The Triple Bottom pattern is a reliable technical analysis tool for identifying bullish reversals in the forex market. By understanding its characteristics, stages, and trading strategies, traders can effectively utilize this pattern to make informed trading decisions. However, like all technical patterns, it is crucial to combine it with other technical indicators and fundamental analysis for a comprehensive trading strategy.
Refer to the images below for The Triple Bottom Forex Chart Pattern’s pictorial guidance;
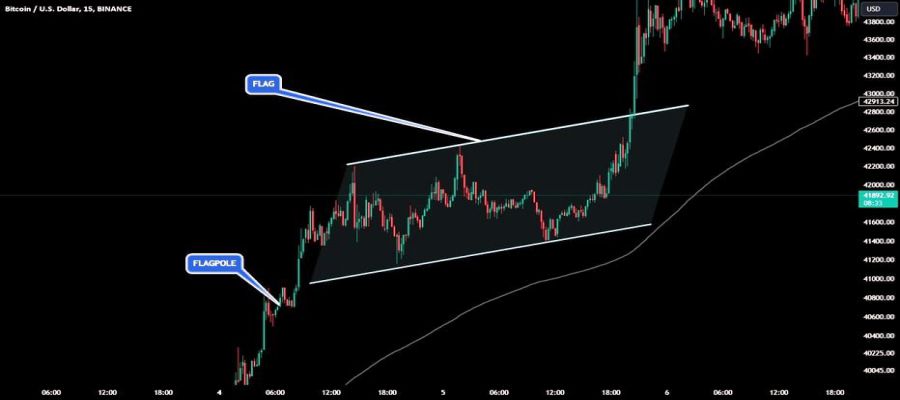
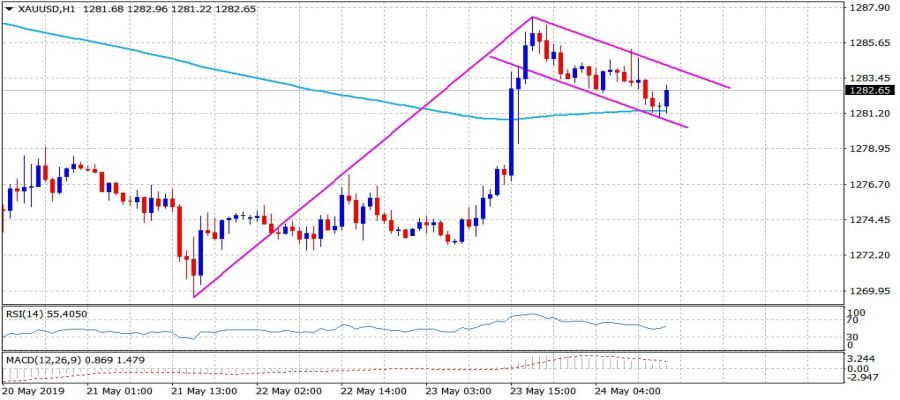
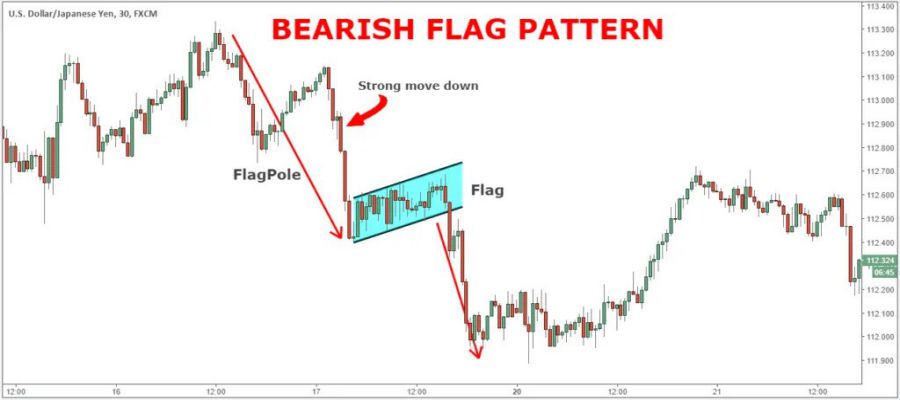
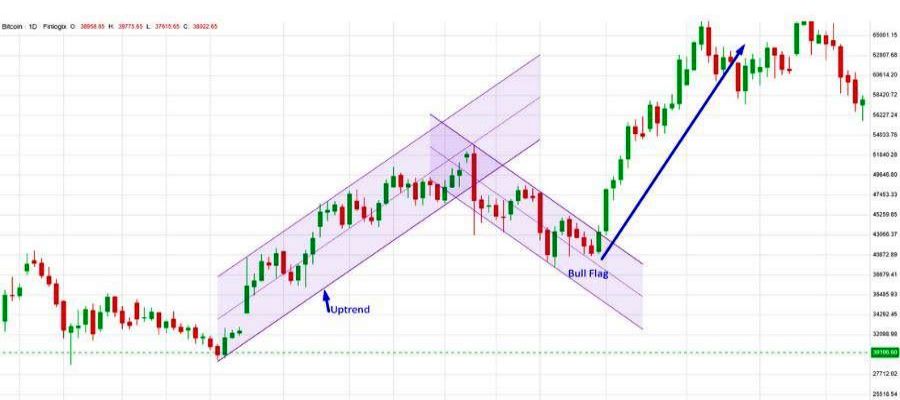
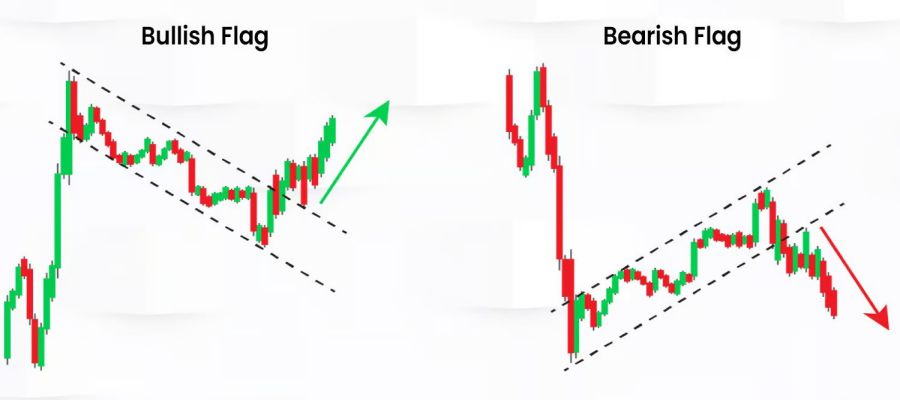
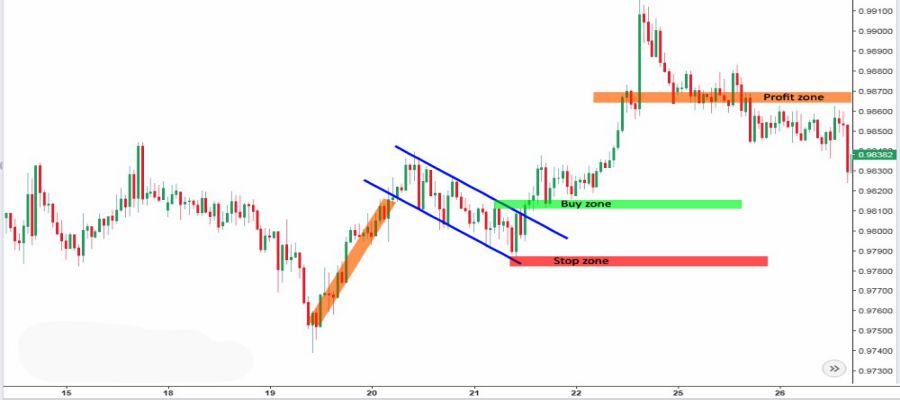
Last in the list, a flag chart pattern is a technical analysis tool used in stock trading to identify potential continuation signals. This pattern resembles a flag on a pole, where the “pole” represents a sharp price movement either upward (bullish flag) or downward (bearish flag), and the “flag” is a period of consolidation that slopes slightly against the trend of the pole. The flag typically forms after the strong price movement as the market takes a brief pause before continuing in the same direction. This pattern indicates that the initial momentum is likely to resume once the consolidation phase concludes.
Traders often look for a breakout from the flag formation to confirm the continuation of the trend. In a bullish flag pattern, traders anticipate a breakout above the flag’s resistance level, signaling further upward movement. Conversely, in a bearish flag pattern, a breakout below the flag’s support level indicates a continuation of the downward trend. The flag pattern is considered a reliable indicator when accompanied by high trading volume during the formation of the pole and lower volume during the consolidation phase, followed by increased volume again during the breakout.
Refer to the images below for The Flag Forex Chart Pattern’s pictorial guidance;
Conclusion
In conclusion, understanding and utilizing the top 10 Forex chart patterns—Head and Shoulders, Inverse Head and Shoulders, Broadening Formation or Megaphone, Volume Candlestick Pattern, Triangle Chart Pattern, Double Top Chart Pattern, Double Bottom Chart, Triple Top Forex Chart Pattern, Triple Bottom Forex Chart Pattern, and Flag Forex Chart Pattern—can significantly enhance your trading strategy. Each of these patterns provides unique insights into market dynamics, helping traders anticipate potential reversals, continuations, and key price movements. By recognizing these patterns, traders can make more informed decisions, improve their entry and exit points, and ultimately increase their profitability in the Forex market.
Moreover, incorporating these chart patterns into your technical analysis toolkit allows for a more comprehensive approach to trading. While no single pattern guarantees success, combining multiple patterns with other technical indicators and sound risk management practices can lead to more consistent and reliable trading outcomes. Continual learning and practice in identifying and interpreting these patterns will build your confidence and skill as a trader. Staying vigilant and adaptable in your analysis will enable you to navigate the complexities of the Forex market more effectively, turning potential challenges into opportunities for growth and success.
Hope you enjoyed the “The Top 10 Forex Chart Patterns”, in case of query feel free to join discussion below or contact us.

